Reading My Own Graph: A Week Inside Poker Variance
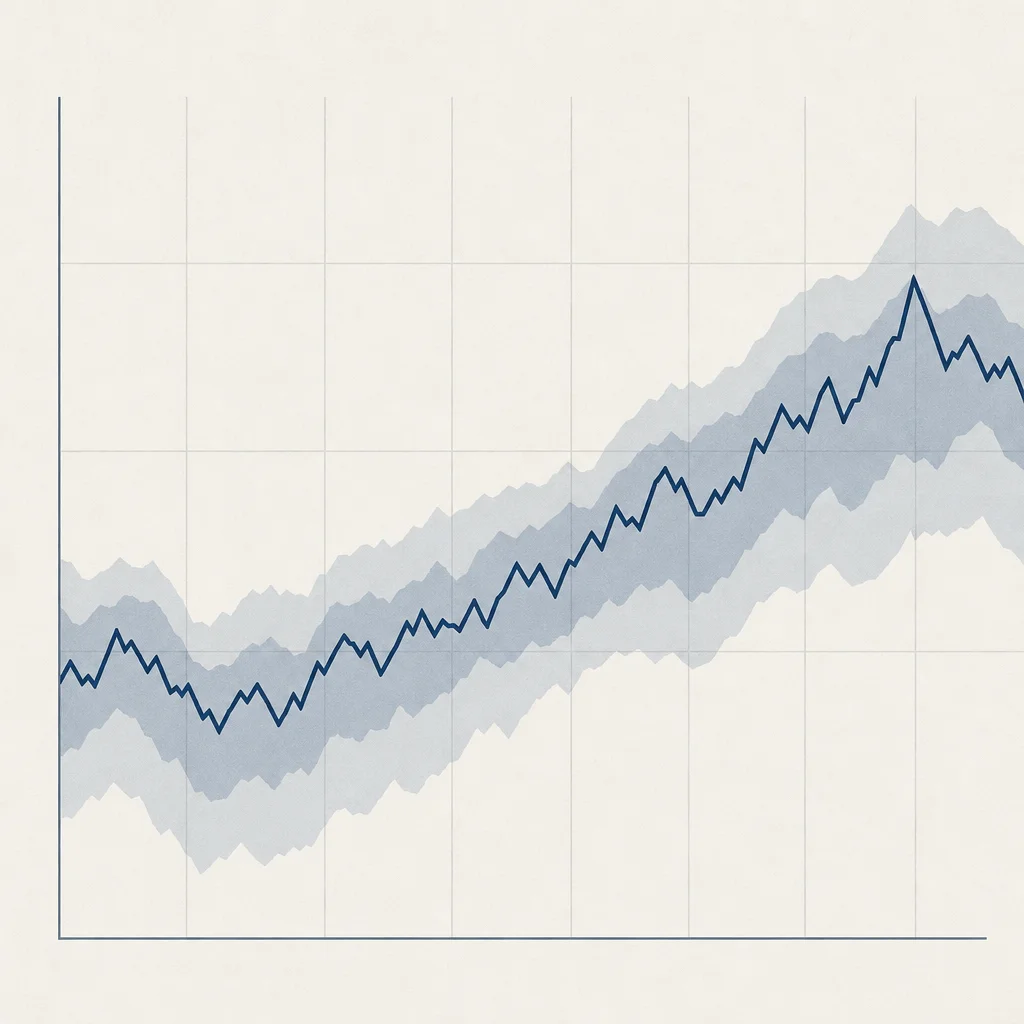
Tuesday night, up 4 buy-ins. Thursday, down 6. Friday, back up 2. My winrate line hadn't moved much all week, but the graph looked like a seismograph, and I finally got curious enough to actually run the numbers instead of just squinting at them. So I fed three months of session data into a poker variance calculator and asked it a plain question: is this normal, or am I actually doing something wrong? Poker variance is the swing between your expected long-run result and what you actually book in any given stretch of hands, and it's a bigger part of the game than most players want to admit.
I'm not going to pretend I ran this test out of pure intellectual curiosity. I ran it because Thursday's session felt like proof I'd forgotten how to play, and I wanted the math to either back that up or talk me down. It talked me down, mostly. I've known about poker variance in the abstract for years — everyone who plays long enough picks up the word — but actually plotting my own hands against a confidence band was different from just nodding along to the concept.
Running the Numbers, Not Just the Graph
I plugged in my sample: around 42,000 hands at NL200 6-max, a winrate of roughly 4.5bb/100, and a standard deviation near 90bb/100 — fairly typical for full-ring-adjacent 6-max cash. The tool spat out a 95% confidence band, and my actual results sat comfortably inside it. Not near the edge, not flirting with the outer line. Comfortably inside. That's online poker variance doing exactly what it's supposed to do — not punishing me, just being noisy.
Here's the part that stuck with me: a single 6-buy-in downswing over two days is well within one standard deviation at this sample size. I'd been treating Thursday like a data point. It's closer to a rounding error. Every poker variance calculator I've used works from the same three inputs — hands played, winrate, and standard deviation — so the output is only as honest as the numbers you feed it, and mine came straight from three months of tracked sessions rather than a guess.
The Line I Keep Coming Back To
Poker variance explained simply: it's the statistical spread between your true winrate and what shows up in any finite sample, driven by the fact that even a correct decision loses a meaningful chunk of the time. Flip a coin that's weighted 55/45 in your favor and you can still lose ten flips in a row. That's not the coin malfunctioning — that's just what a 45% chance looks like sometimes. Poker works the same way, except the coin flip is a set-mining opponent hitting a two-outer, and it happens often enough that you'll see it every single week you play seriously.
The reason this matters isn't academic. It's that variance is the thing that makes a bad decision and a bad result look identical in the short run, and a good decision and a bad result look identical too. You can't tell them apart from one hand, or one session, or honestly one week. You need volume, and you need to already know your inputs — winrate estimate, standard deviation, hands played — before the number means anything. That's basically what poker variance explained in one sentence looks like: results lag behind decisions, sometimes by tens of thousands of hands. (see law of large numbers).
Where I Started Looking for the Verdict Instead
What changed for me this week wasn't the poker. It was where I looked for the verdict. I stopped asking Thursday's session what it thought of my play and started asking whether the whole month sat inside the range the calculator predicted. It did. That's a much calmer place to make decisions from than a single ugly night, and it's also just a more honest read of online poker variance than eyeballing a graph on my phone between hands.
I'm not claiming this fixes anything — I still tilted a little on Thursday, and I'll probably tilt again next month when the same thing happens. What it does is give me a number to check the feeling against, instead of just trusting the feeling. That's a different conversation than the tilt itself, though, and I've written about that side of things separately — the actual downswing narrative lives over on the piece I did about riding one out, not here.
If I'm honest about what I'd change, it's not my strategy. It's my sample size discipline — I keep drawing conclusions from 3,000-hand chunks when the variance math says I need five to ten times that before a winrate estimate stabilizes. I know this. I'll probably do it again next week anyway, because a bad Tuesday feels urgent in a way that a three-month rolling average never does. That gap between what I know and what I do is basically the whole game.
Where variance intersects with how much money you actually risk on any given stretch is its own topic, and it's a bigger one than a single entry can hold — I've laid out the buy-in math properly on the bankroll management page rather than trying to squeeze it in here.